No products in the cart.

Quick answer: A fleet dashboard can display hundreds of numbers, but management needs a smaller set that explains whether vehicles are available, productive, safe and cost-effective. Good KPIs connect directly to decisions and use definitions that remain consistent from one reporting period to the next.
What you will learn
Utilisation and availability
Utilisation shows how much a vehicle is used relative to the time or capacity available. Low utilisation may indicate excess vehicles, uneven allocation or operational constraints. Availability shows whether an asset is ready for work when required.
These measures should be viewed by vehicle type and business purpose. A standby emergency vehicle should not be judged by the same utilisation target as a scheduled delivery van.
- Active days and journeys
- Distance travelled
- Available versus out-of-service time
- Vehicles with prolonged inactivity
Journey and route performance
Journey reports help managers understand start times, duration, stops, route adherence and completion. They can reveal bottlenecks at particular locations or recurring delays that dispatch teams can address.
Avoid ranking drivers solely by total distance or number of trips. Routes vary, and a fair comparison requires customer, cargo, traffic and vehicle context.
- On-time departure and arrival
- Journey duration
- Unplanned stops
- Route exceptions
Safety and driver indicators
Speed events, harsh-event patterns and after-hours operation can support safety review. Use rates per distance or journey where possible so high-mileage drivers are not automatically treated as higher risk.
Combine indicators with incident records and coaching outcomes. The goal is to reduce exposure and improve behaviour, not to create a scoreboard without context.
- Event rate per 1,000 kilometres
- Repeat exception patterns
- Coaching actions completed
- Incident frequency
Build a reporting rhythm
Operational teams may need daily exception reports, managers a weekly performance view and leadership a monthly summary. Each report should name an owner and lead to an action when a threshold is missed.
Ciska IQ brings live and historical information into dashboards and reports that can support this rhythm. Start with a small KPI set, improve data quality and expand only when the additional measure will change a decision.
- Daily exceptions
- Weekly team review
- Monthly management summary
- Quarterly policy and asset review
A practical action plan
Begin with a representative group of vehicles and record a baseline before changing policy. Agree on the few measures the team will review, train the people responsible for action and hold a short weekly meeting that turns exceptions into documented improvements.
- Utilisation and availability: Active days and journeys
- Journey and route performance: On-time departure and arrival
- Safety and driver indicators: Event rate per 1,000 kilometres
- Build a reporting rhythm: Daily exceptions
Ciska Fleet Pro and Ciska IQ connect current vehicle status with journeys, events and reports. That combination supports operations on the day and gives management a historical record for coaching, planning and performance review.
Frequently asked questions
What is the most important fleet KPI?
There is no single universal KPI. Choose measures tied to the organisation’s priorities, such as availability, safety, service reliability or cost.
How many KPIs should a fleet dashboard show?
A concise set of five to ten core measures is usually more actionable than a large collection without clear ownership.
How often should fleet reports be reviewed?
Urgent exceptions may be daily, operational trends weekly and strategic measures monthly or quarterly.
Take the next step with Ciska
This guide becomes more useful when the ideas are connected to the right hardware, installation and tracking software. For this topic, start with Ciska Fleet Pro.
Continue reading
Choose connected hardware and Ciska IQ software for cars, fleets, delivery bikes, cold cargo and inland vessels. Live tracking, journey history, geofences and smart security alerts. Fleet visibility, driver insight, operational alerts and business reporting. Multi-customer fleet intelligence for tracking companies and enterprise teams. Location and temperature visibility for food, medicine and sensitive cargo. Compact GPS tracking for dispatch bikes and last-mile delivery fleets. Route history, location visibility and operating-area alerts for inland vessels. Vehicle diagnostics with authorised-driver identification and accountability. A connected probe for reliable cold-chain and sensitive-cargo temperature data.Explore the Ciska ecosystem View all products →One tracking family. Every kind of movement.
 Personal vehicle protection
Ciska Hybrid Pro
₦80,000.00View Ciska Hybrid Pro → Fleet operations
Ciska Fleet Pro
₦85,000.00View Ciska Fleet Pro →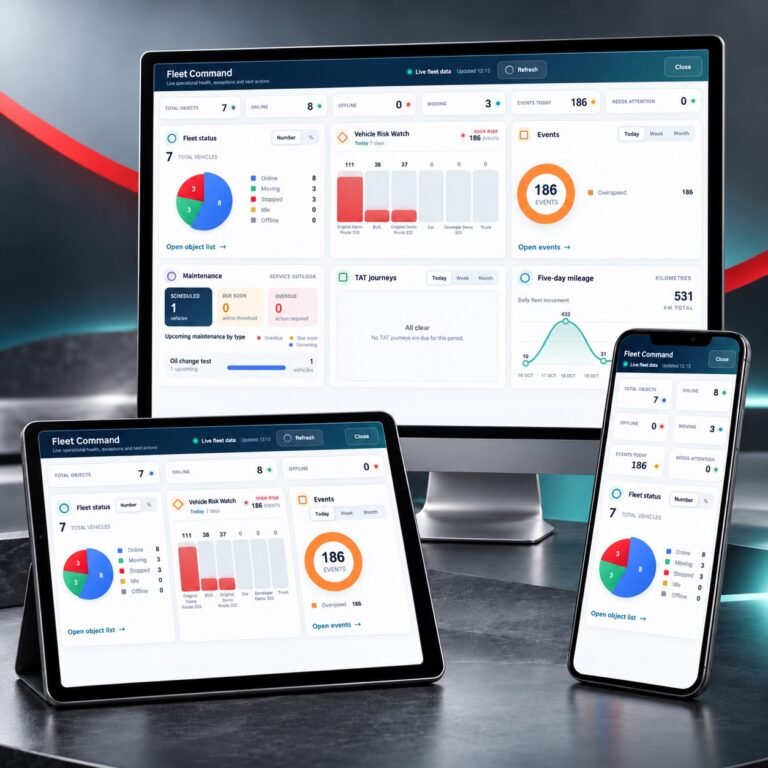 Tracking software
Ciska IQ AI Tracking Platform
 Cold-chain monitoring
Ciska Cold
₦265,000.00View Ciska Cold → Bike and delivery tracking
Ciska Dispatch
₦70,000.00View Ciska Dispatch → Marine tracking
Ciska Boats
₦80,000.00View Ciska Boats →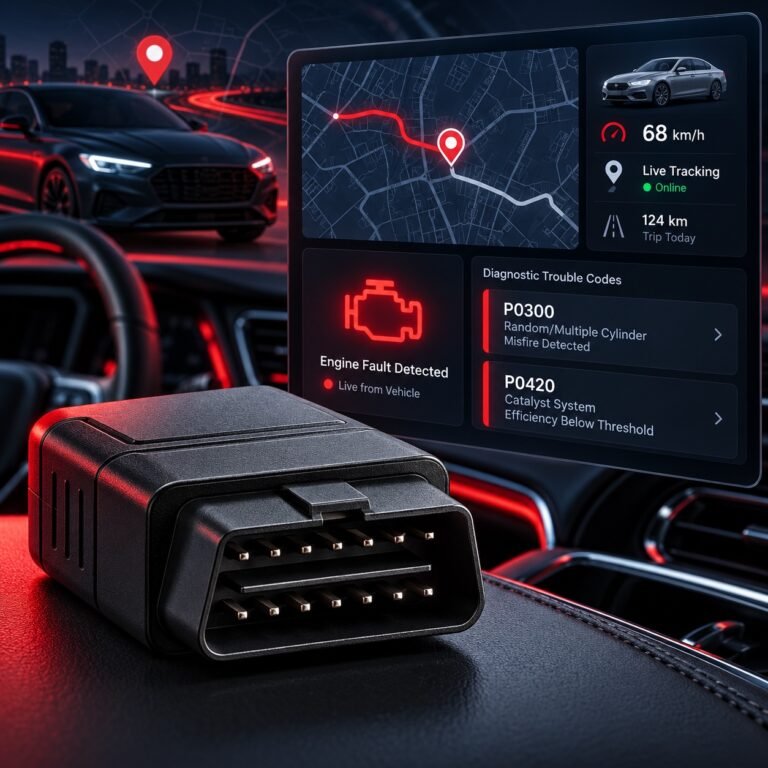 Diagnostics and driver ID
Ciska OBD-II + RFID
₦140,000.00View Ciska OBD-II + RFID →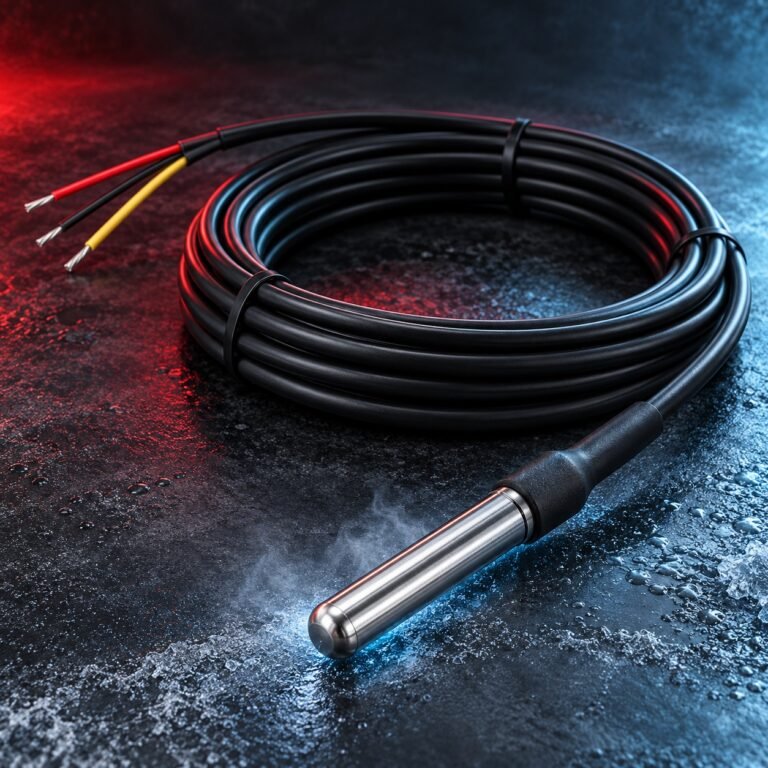 Temperature sensing
Ciska Temperature Probe
₦55,000.00View Ciska Temperature Probe →